Pair correlation functions for polymer chains in molecular dynamics simulations
Introduction
Pair correlations were performed within chains and between chains from the first time-step of the aniso_11 simulation. The pair correlation is essentially a histogram of the distance between all particles where the radial distance between particles is binned. This binning may or may not be normalized by the volume of the ‘shells’ created by this binning scheme (i.e. at farther correlation distances the effective shell volume would increase, and so would the number of particles within the bounds of that bin). All plots are from the dump.deform375_10e7_5aniso_11 simulation file.
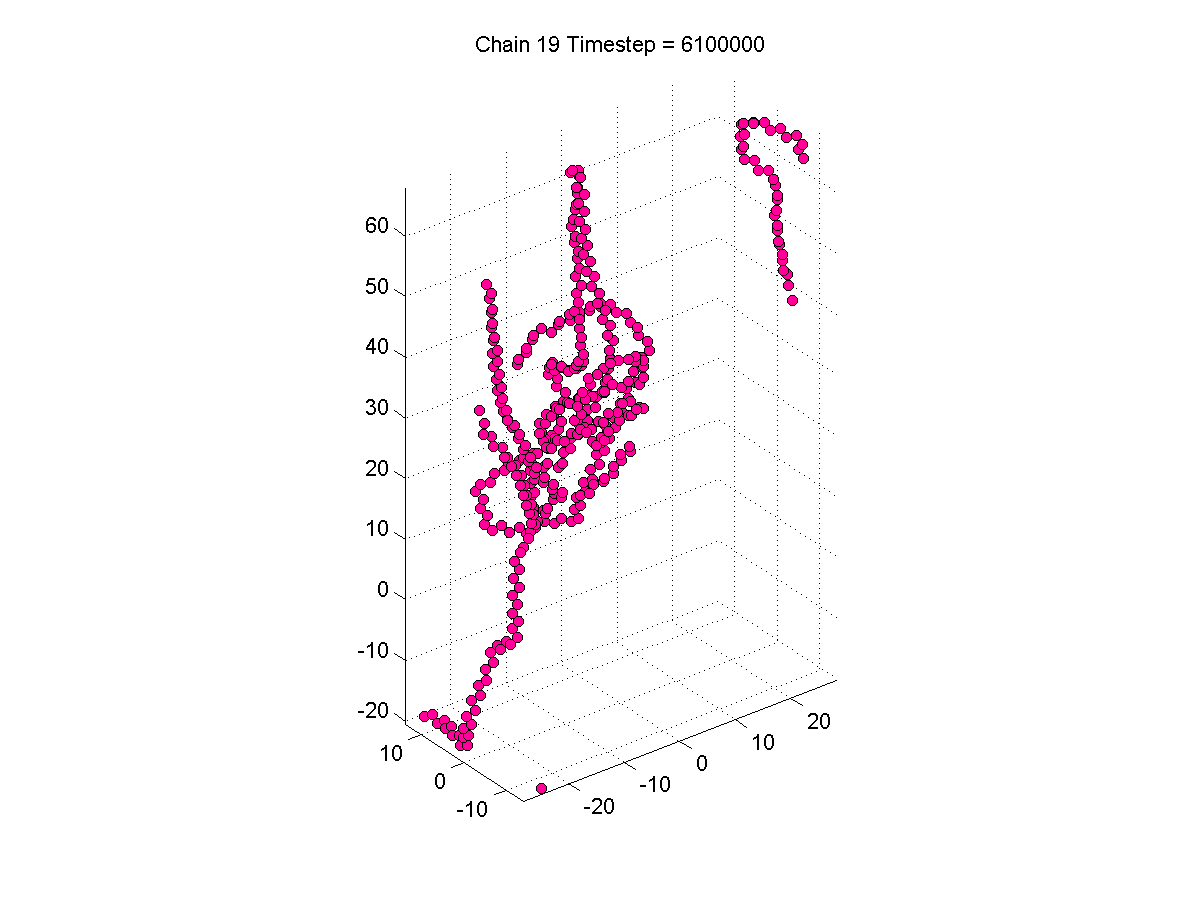
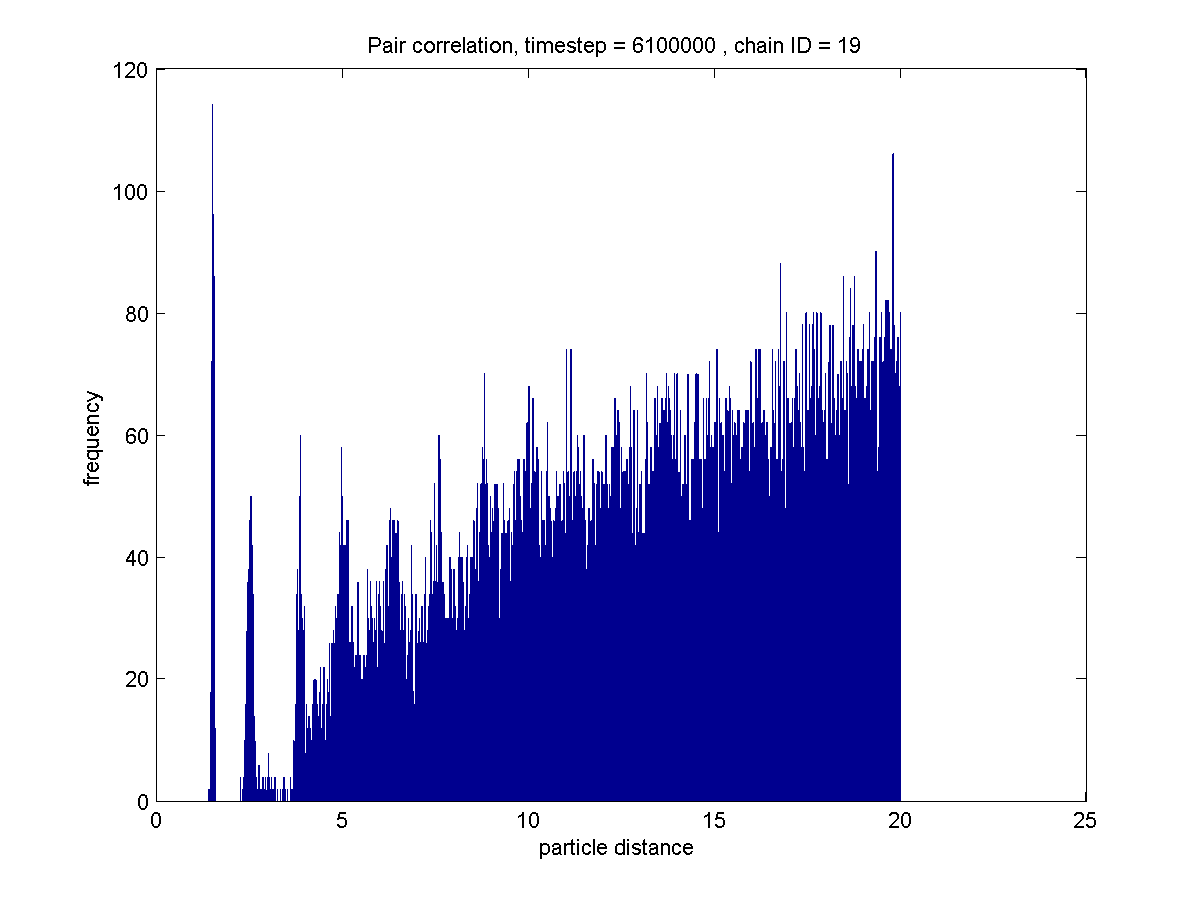
First, two chains were chosen for analysis, one which appeared more amorphous, and on which appeared more crystalline, both from the first time-step of the aniso_11 simulation. Pair correlations were performed on each of these chains. The chains were tiled to account for periodicity, and the maximum distance considered was 20 units
Images of the “amorphous” chain and the associated pair correlation are included below
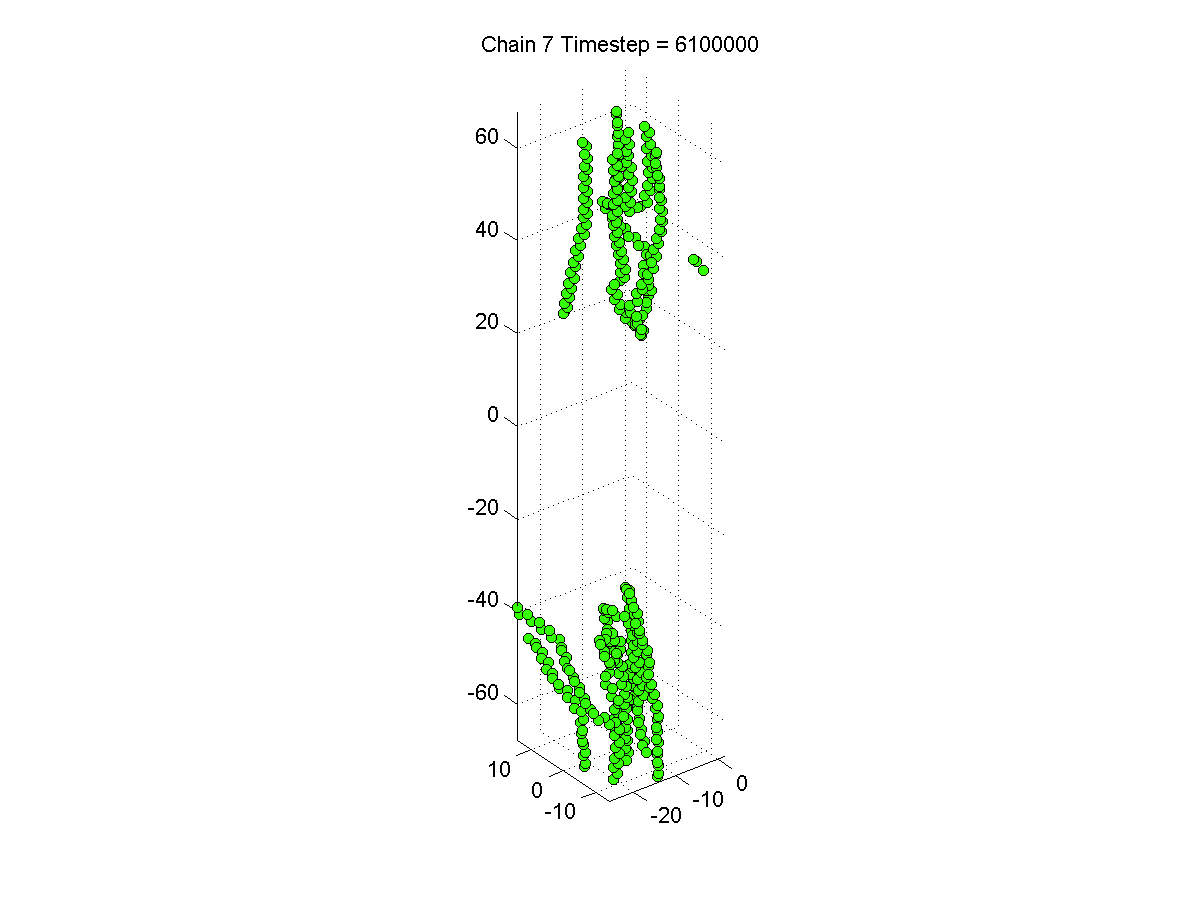
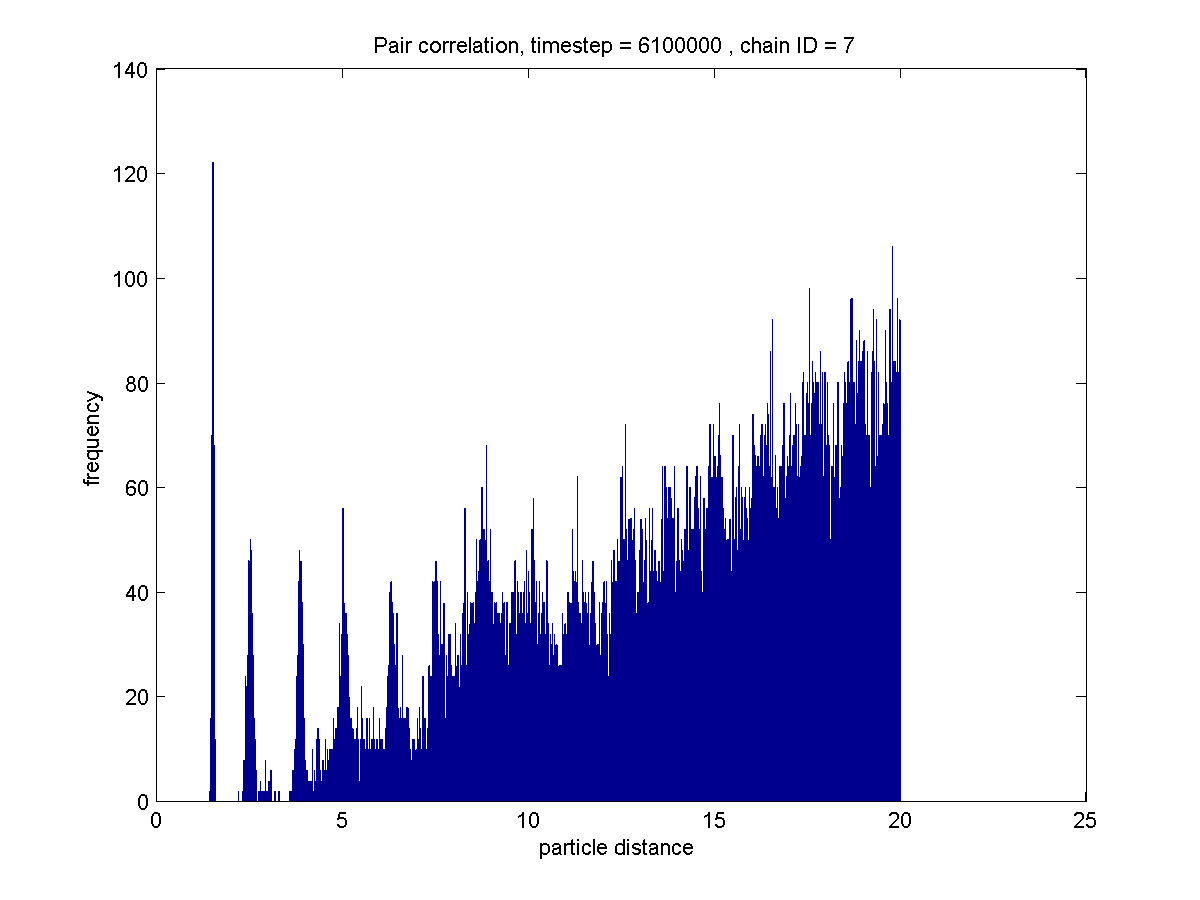
Images of the “crystalline” chain and the associated pair correlation are included below
Then, the pair correlation between two ‘crystalline’ chains was performed. The distances between each particle in the first chain and every other particle in the second within 20 units were considered (where the second chain was tiled to account for the periodicity of the structure)
Images of both “crystalline” chains and their associated pair correlation are included below
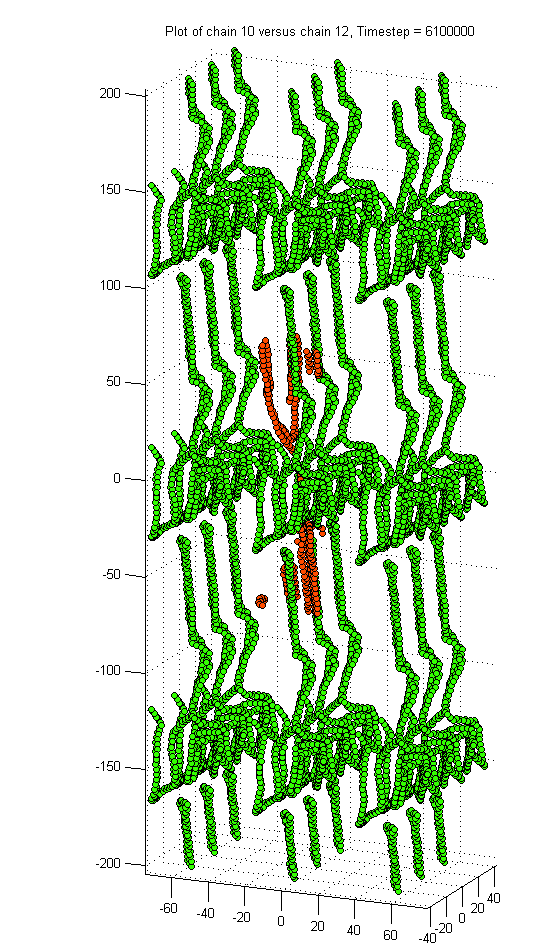
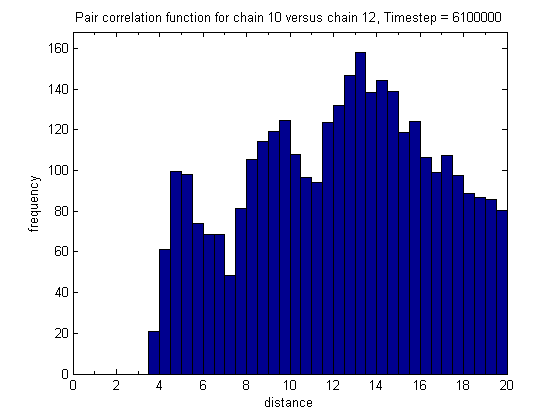
The pair correlations from within a single chain clearly show the periodicity of structure at a close distance, though the differences between the ‘amorphous’ and ‘crystalline’ pair correlations are not clear. In addition, it is not clear what trend, if any can be resolved from the pair correlation between adjacent chains.
Other plots from this effort can be viewed in this flickr album
Relevant Codes
The codes which produced these plots can be found at this link
The relevant codes include:
-
read_conv_data_nhp_v2.m : This script reads the plaintext simulation files and produces a Matlab file (total_info_xx.mat), containing arrays of the time-steps, number of monomers, bounds of the simulation volume and locations of all monomers and chains for the length of the simulation. Note that the original aniso files have some corrupted data which must be removed for the script to function.
-
pair_correlation_single_chain_v3.m : This script calculates the pair correlation within a specified chain
-
pair_correlation_two_chain_v1.m : This script calculates the pair correlation between two specified chains