Plotting volume and monomer displacement versus simulation time-step
Plots
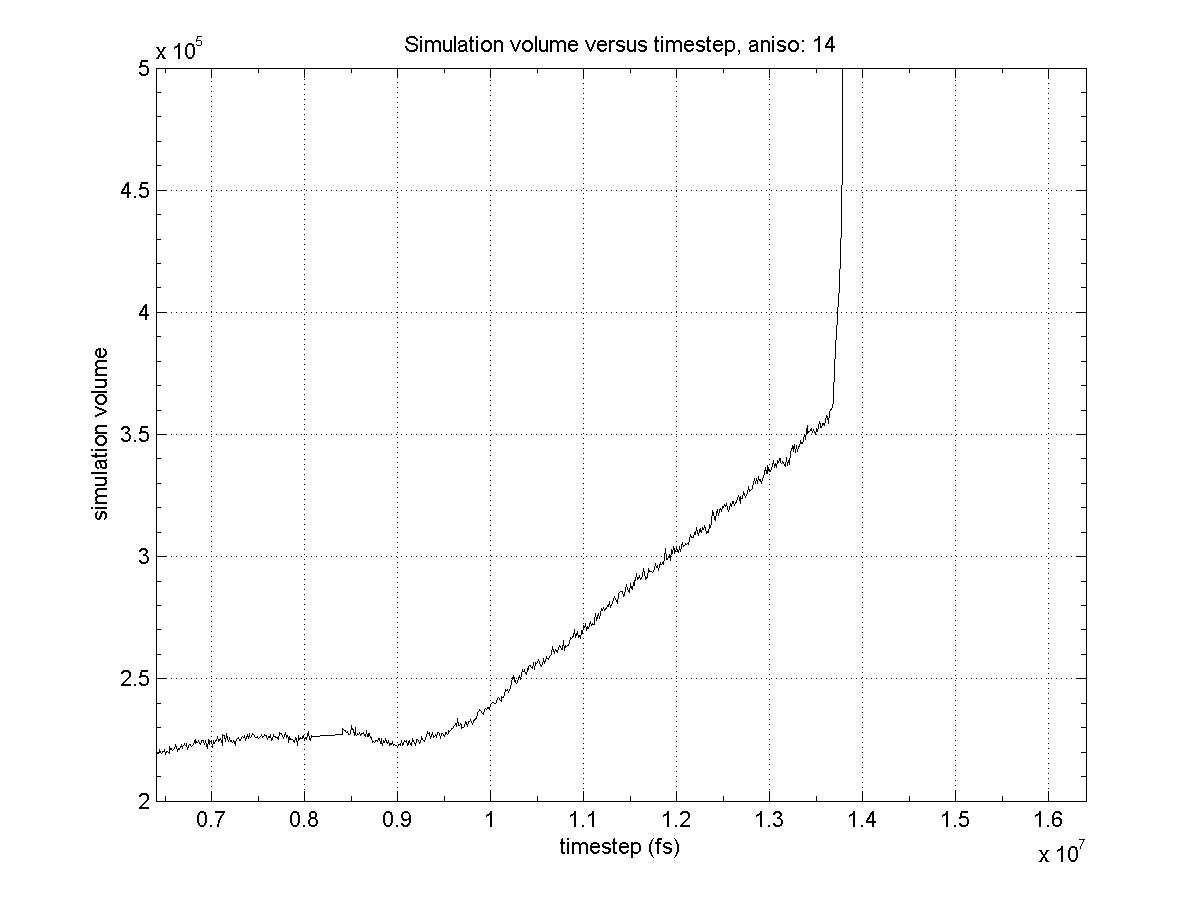
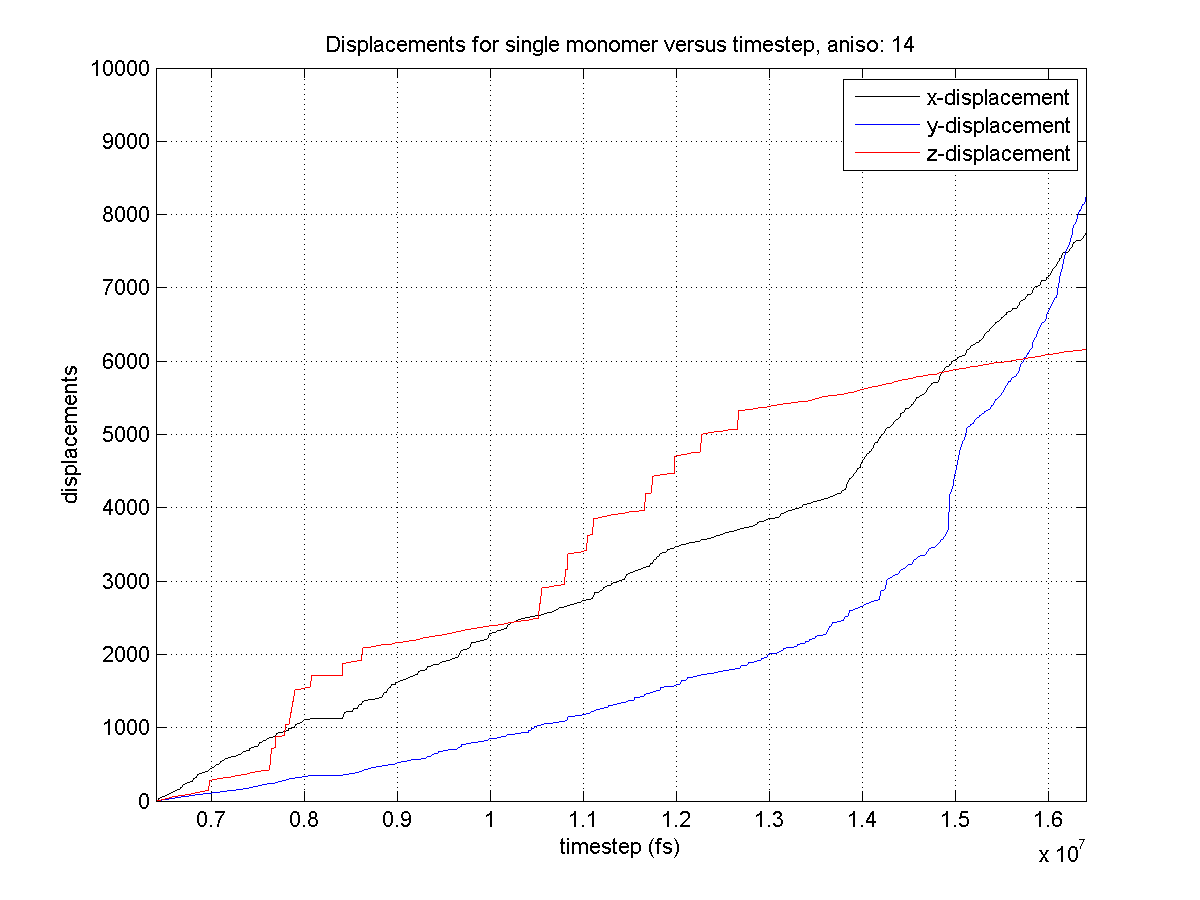
The purpose of this post is to highlight a few plots that may be able to shed light on some of the phenomena seen in the aniso simulations. All plots are from the dump.deform375_10e7_5aniso_14 simulation file.
aniso14 tot v2 from Noah Paulson on Vimeo.

Displacement is measured as the movement in x, y and z of a specific particle throughout all timesteps.


Similar plots from the other 4 aniso simulations can be viewed in this flickr album
Relevant Codes
The codes which produced these plots can be found at this link
The relevant codes include:
-
read_conv_data_nhp_v2.m : This script reads the plaintext simulation files and produces a Matlab file (total_info_xx.mat), containing arrays of the time-steps, number of monomers, bounds of the simulation volume and locations of all monomers and chains for the length of the simulation. Note that the original aniso files have some corrupted data which must be removed for the script to function.
-
plot_vol_displacement_timestep.m : This script generates three plots for each simulation dataset