Autocorrelations on Monomers with Specified Radius
In order to more realistically represent the structure of the polyethylene structure each monomer was assigned a radius of half the carbon-carbon bond distance. This also improves the usefulness of the autocorrelation (non-periodic) of the monomers as it increases the monomer volume fraction in the microstructure function.
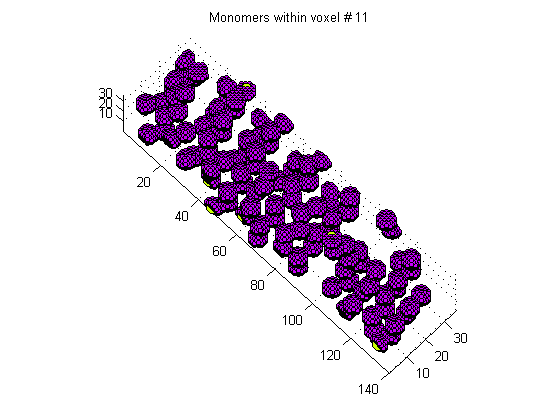
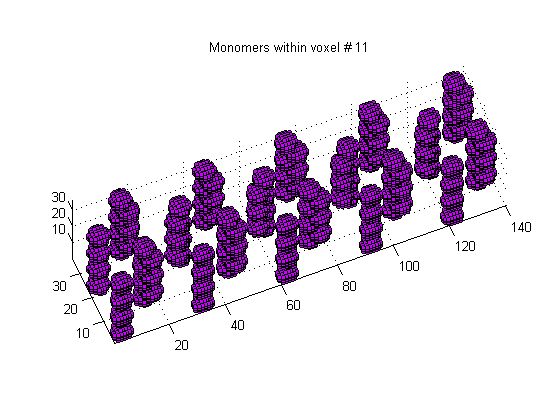
The following two images show the microstucture functions of both imperfect and perfect crystals. Each purple circle represents a voxel of the monomer phase. The yellow circles show the center of each monomer (before binning)
3D image of the microstructure for a section of imperfect PE crystal

3D image of the microstructure for a section of perfect PE crystal

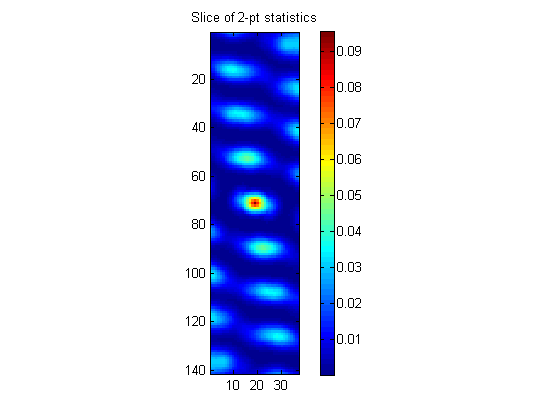
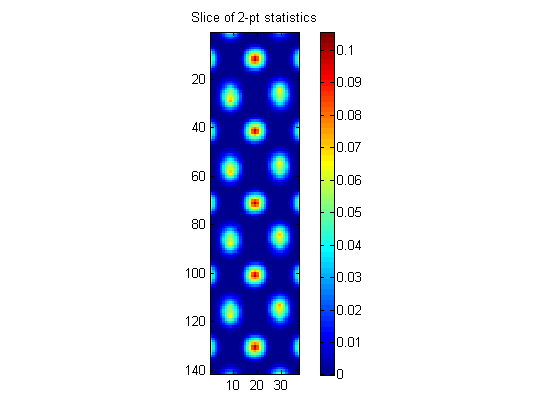
The next two images are autocorrelations for monomers in both imperfect and perfect crystals. Note that the orientation of each crystal is different so the same slice of the autocorrelation for each crystal shows a different pattern.
Slice of the autocorrelation for monomers in an imperfect PE crystal

Slice of the autocorrelation for monomers in a perfect PE crystal

The following plots show the histograms of probabilities for the autocorrelation of monomers in both imperfect and perfect crystals. It is hoped that the levels of the histogram in certain bins (as compared to the histogram for a perfect crystal) will yield information about the degree of crystallinity in that bin.
Histogram of probabilities for the autocorrelation of monomers in an imperfect PE crystal

Histogram of probabilities for the autocorrelation of monomers in a perfect PE crystal

References
- Dong, X. et. al. Dependence of mechanical properties on crystal orientation of semi-crystalline polyethylene structures. Polymer 55 (2014) 4248-4257.
- Dong, X. et. al. Effect of network structure from different processing conditions on the mechanical property of semi-crystalline polymers. MRS Symposium, 1619, 2014.