Visualization of Crystallinity Results
Introduction
In this post we present the preliminary results and procedures for a new measure of crystallinity in polyethylene polymer MD simulations. We use this method, here called crystalline autocorrelation probability, along with density and Herman’s Orientation to characterize the local crystallinity in a single time-step of an MD simulation. As has been cited in the literature (Ko, et al., 2004, and Hossain, et. al., 2010) at higher strain levels the amorphous and crystalline regions of the structure will also align. (See visualization here of uniaxial deformation of amorphous polyethylene). This increases Herman’s orientation for the amorphous region making it challenging to use the parameter to distinguish crystallinity.
Procedure
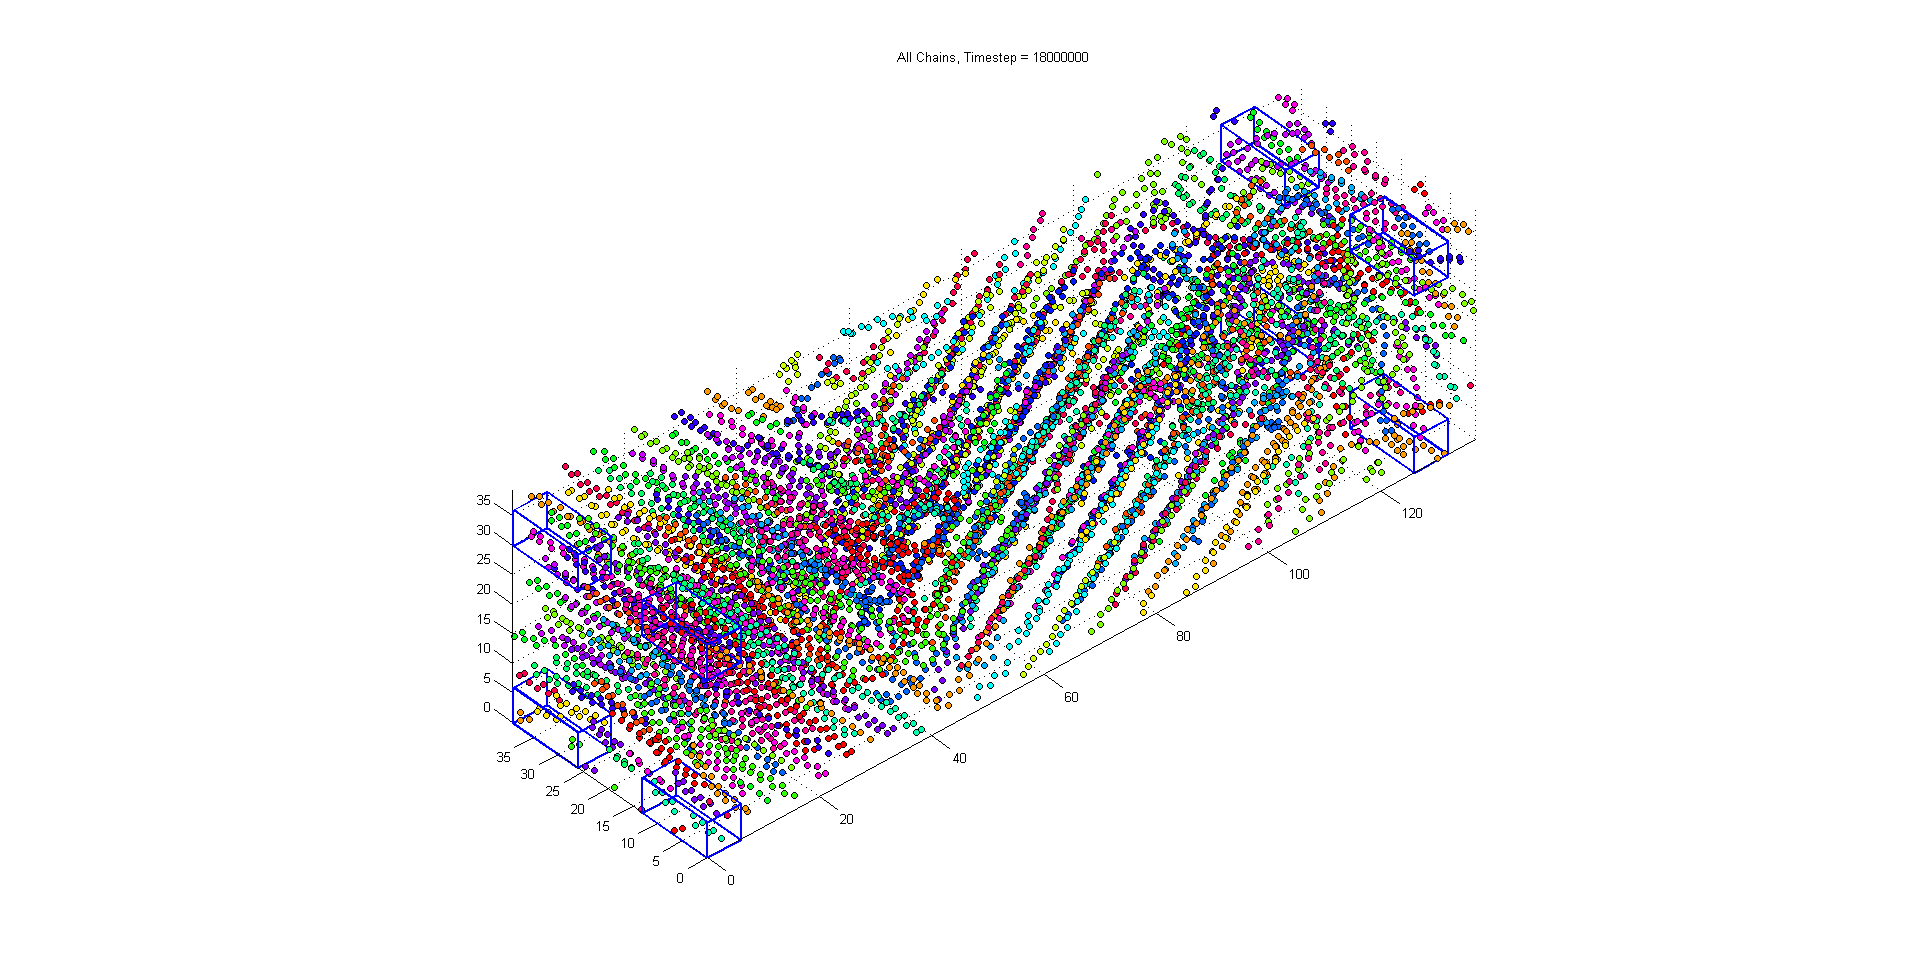
The first step to characterize the crystallinity is to break up the original simulation volume into equally sized bins. These spatial bins have constant dimensions no matter the overall dimensions of the simulation, so that the results of later 2-pt statistics can be compared in principal component space.
this image shows the original monomer and chain locations (where each chain has a unique color) with the locations of the voxels at the 8 corners of the simulation volume outlined in blue
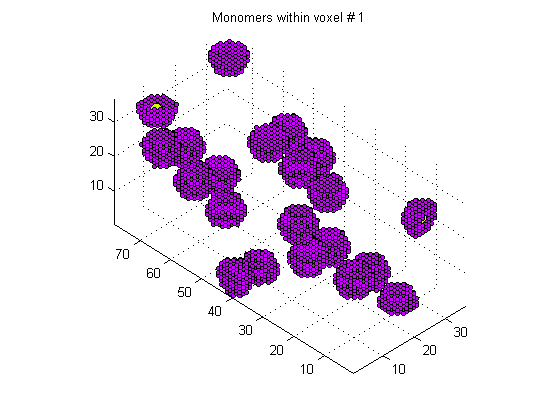
Next, each of these spatial bins is further discretized to a level chosen by the user. In this discretized domain each monomer is represented by a sphere of a specified radius (in this case about half the interatomic distance). This increases the volume fraction of the monomer phase in the 2-pt statistics, and improves the autocorrelation results. The procedure yields a microstructure function the discretized domain where a 1s represent PE material and 0s are open space.
In the image below the original monomer locations are shown in yellow while the volumized monomers are represented by the purple markers
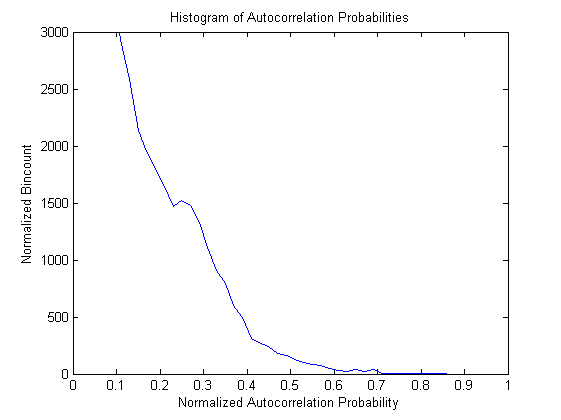
Then a 2-pt statistics autocorrelation is performed on the PE phase of the microstructure function.
below is a slice of the 2-pt autocorrelation for the monomers in the previous image

below is a histogram of the 2-pt statistics autocorrelation probabilities
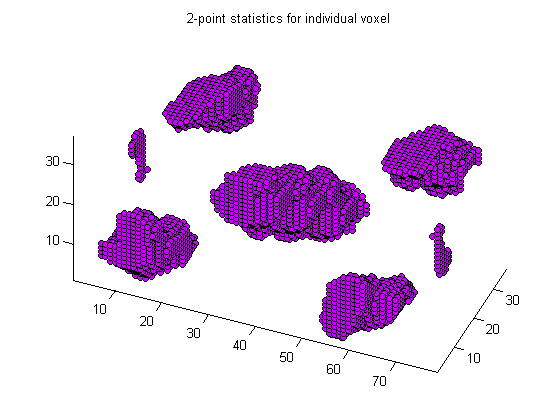
Finally, an autocorrelation probability threshold is chosen and the number of locations in vector space which exceed this probability are counted. The crystalline autocorrelation probability measure in each voxel is currently defined as the number of vectors exceeding a specified probability threshold divided by the number of 1s in the microstructure function in that cell.
below is an image showing all locations in the 3-D voxel where the 2-pt statistics autocorrelation probability exceeds 15%
Results
In this section, density, Herman’s Orientation and crystalline autocorrelation probabilities are shown for each voxel of the simulation at a single time-step. In addition a crystallinity map is associated with each of the three measures where some threshold for crystallinity is defined. Every image is accompanied by a slice of the actual simulation. It is hoped that this will aid the viewer in recognizing the difference between crystalline and amorphous regions in the simulation.
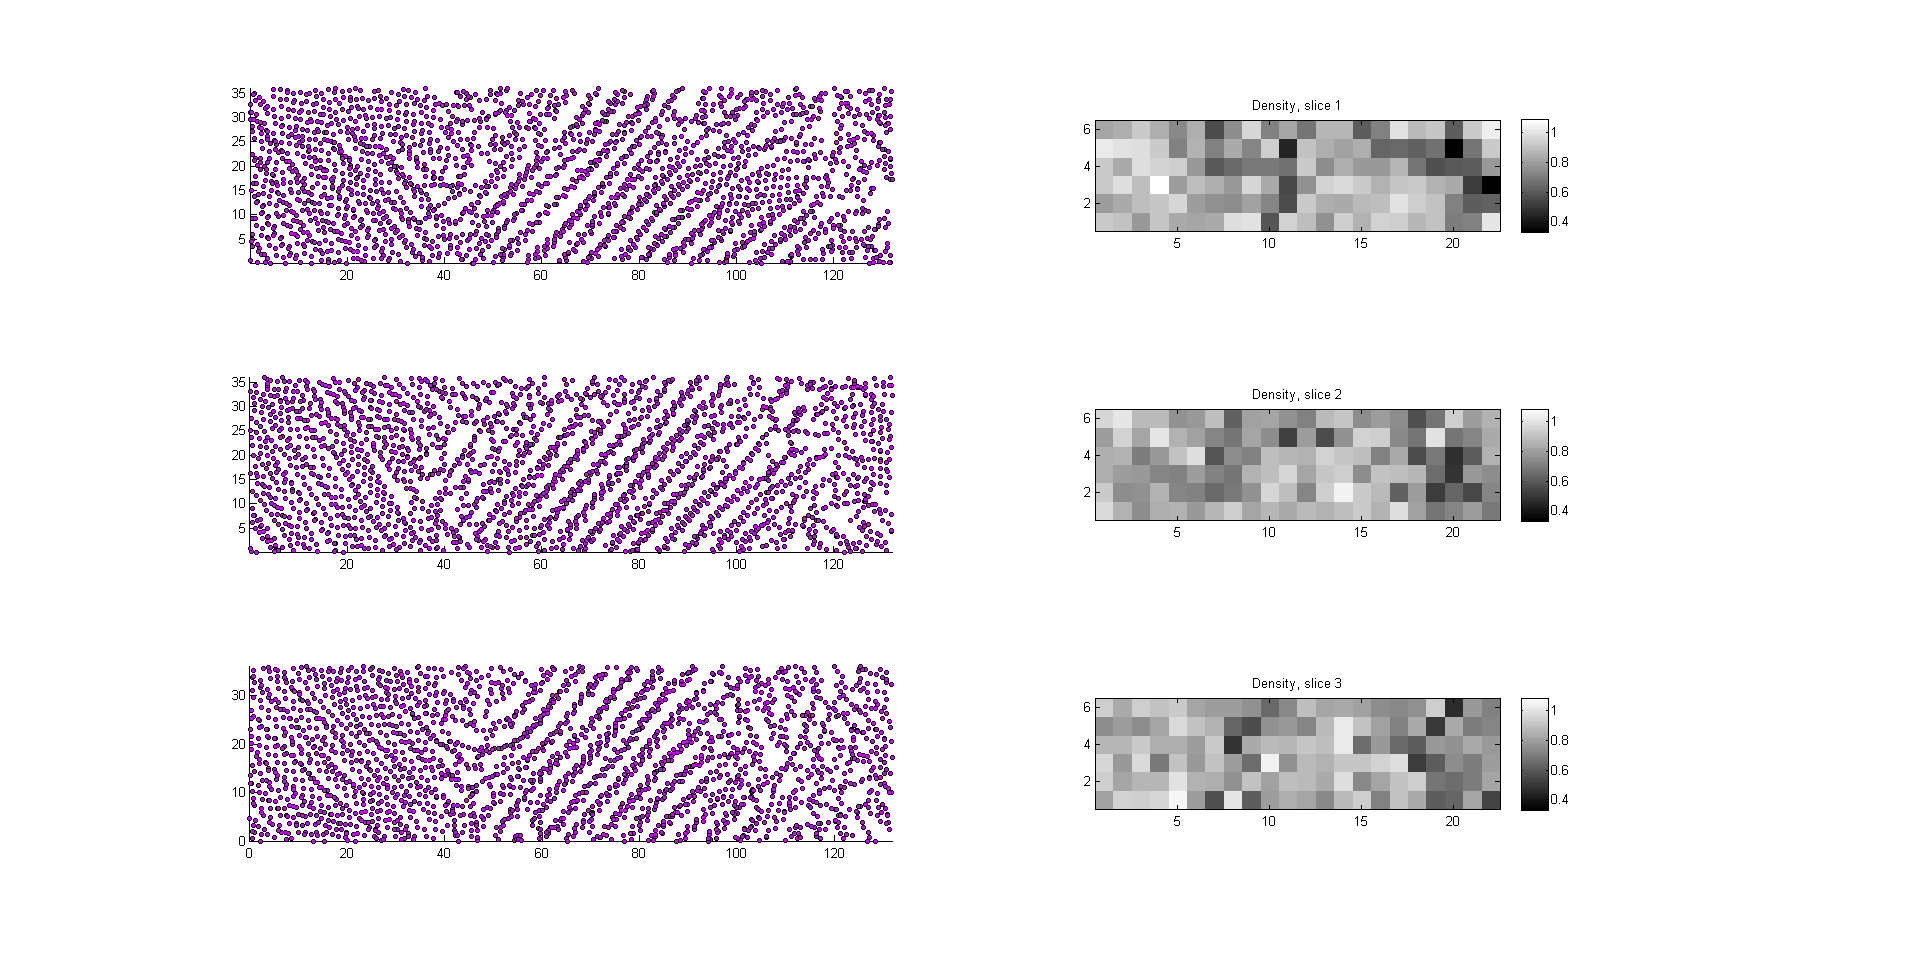
Mass density is calculated in each voxel by the rearrangement of the equation relating number density and mass density.
this image shows the discretized density in each voxel for every slice of the microstructure next to slices of the actual monomer locations
in this image a voxel was considered ‘crystalline’ if the density exceeded 0.853

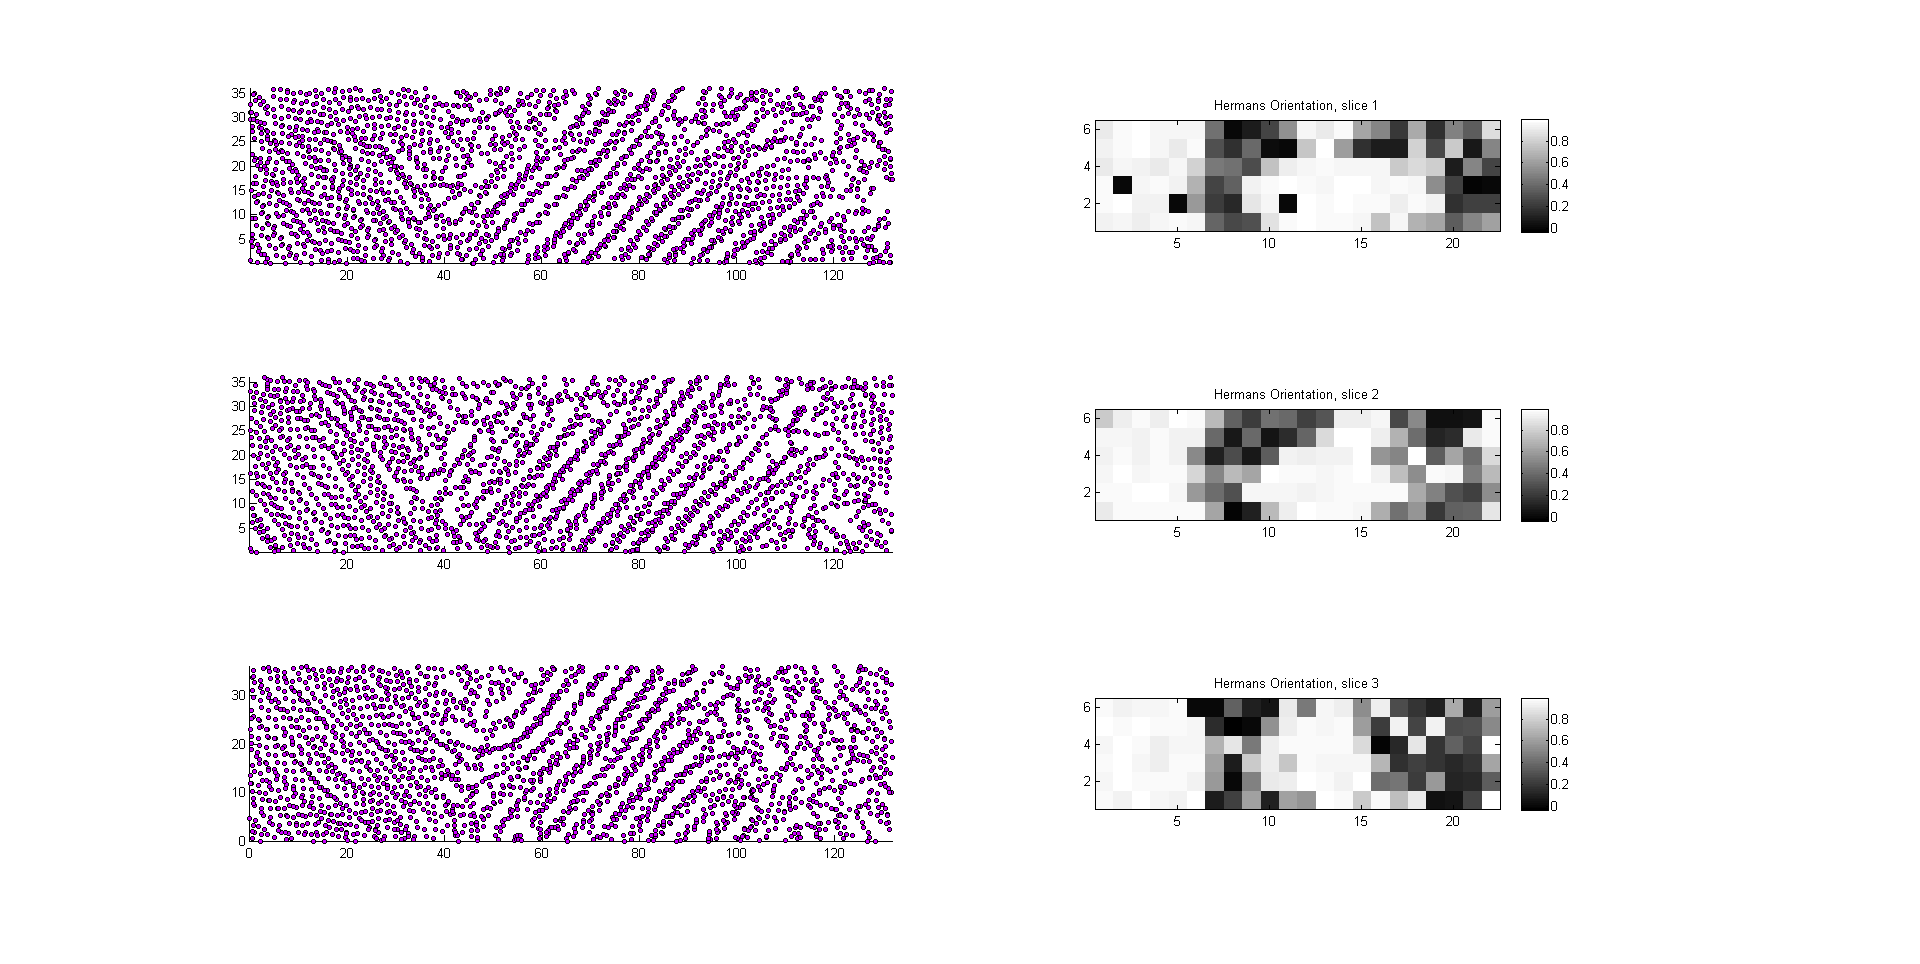
Herman’s Orientation was calculated by modifying the calculation of Dong, et. al, 2014 and Ko, et. al., 2004 where a vector was calculated between every other monomer. The angle between that vector and vectors found for each chain within a voxel was then used in the below equation to obtain Herman’s orientation measures. This process was repeated for all vectors in a voxel and then the average Herman’s orientation was taken for the voxel.
this image shows the Herman’s Orientation measure in each voxel
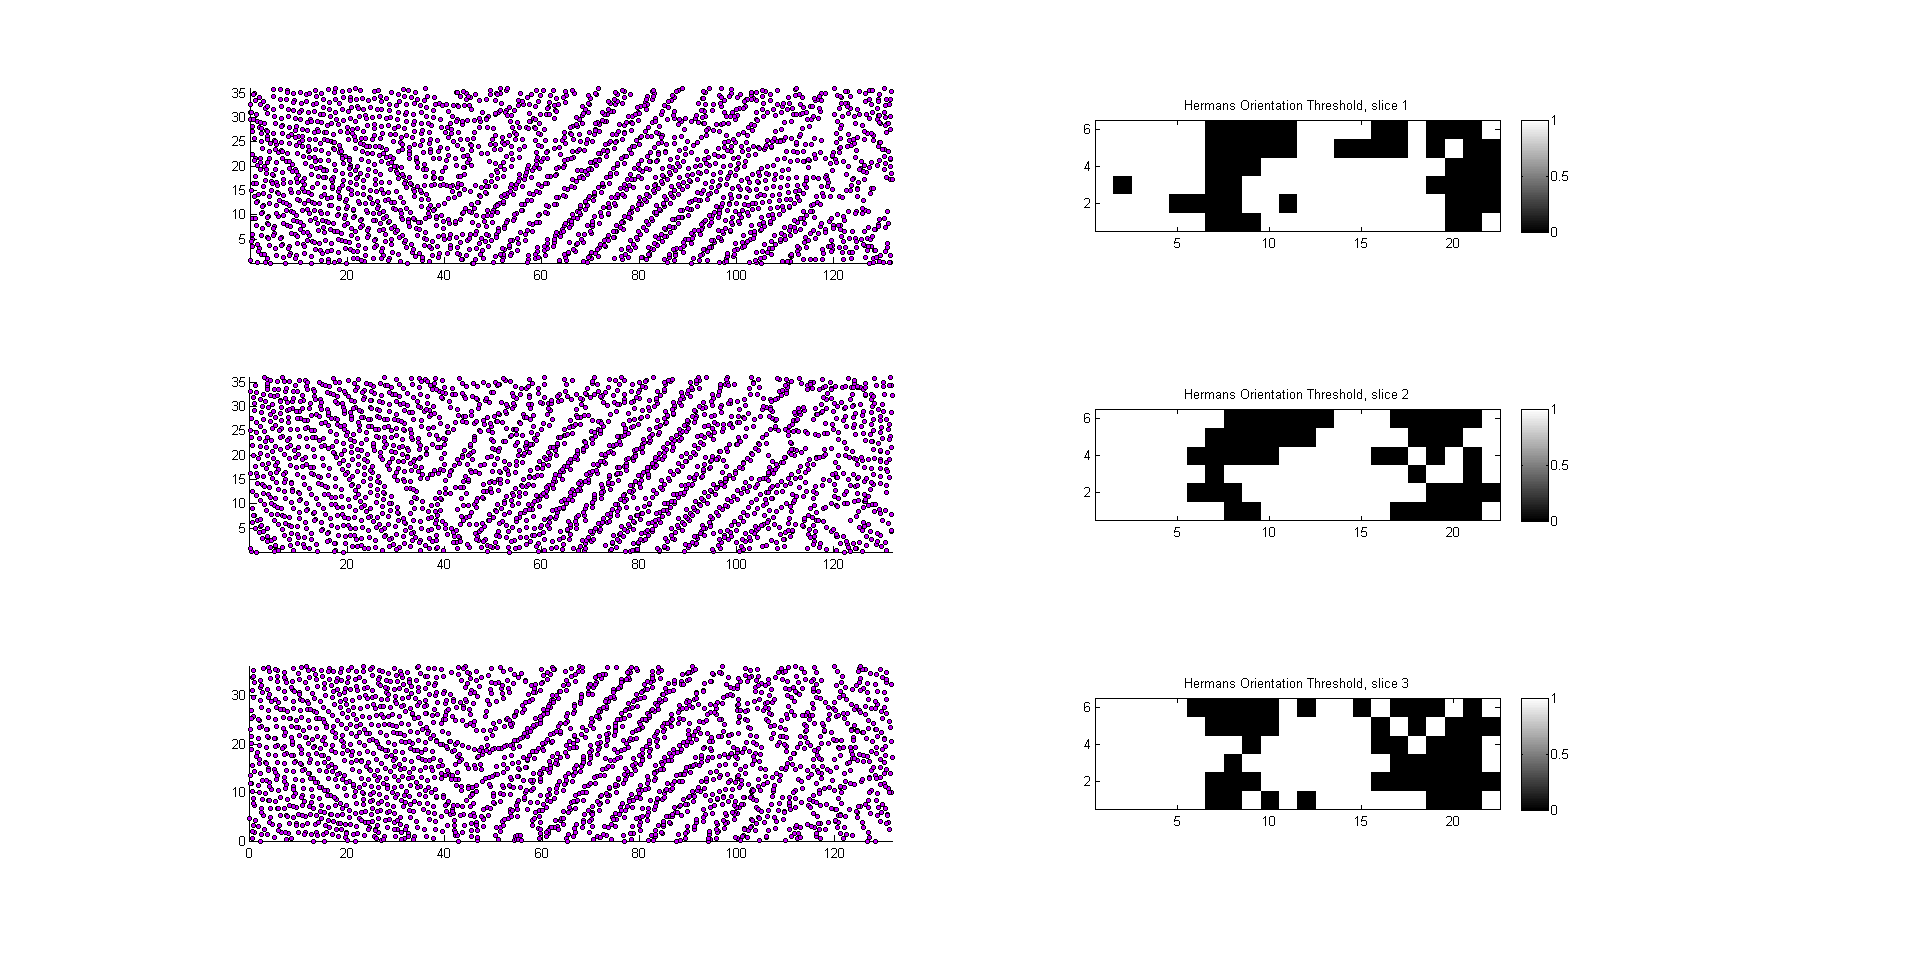
in this image a voxel was considered ‘crystalline’ if the Herman’s Orientation measure exceeded 0.6 (Ko, et al., 2004)
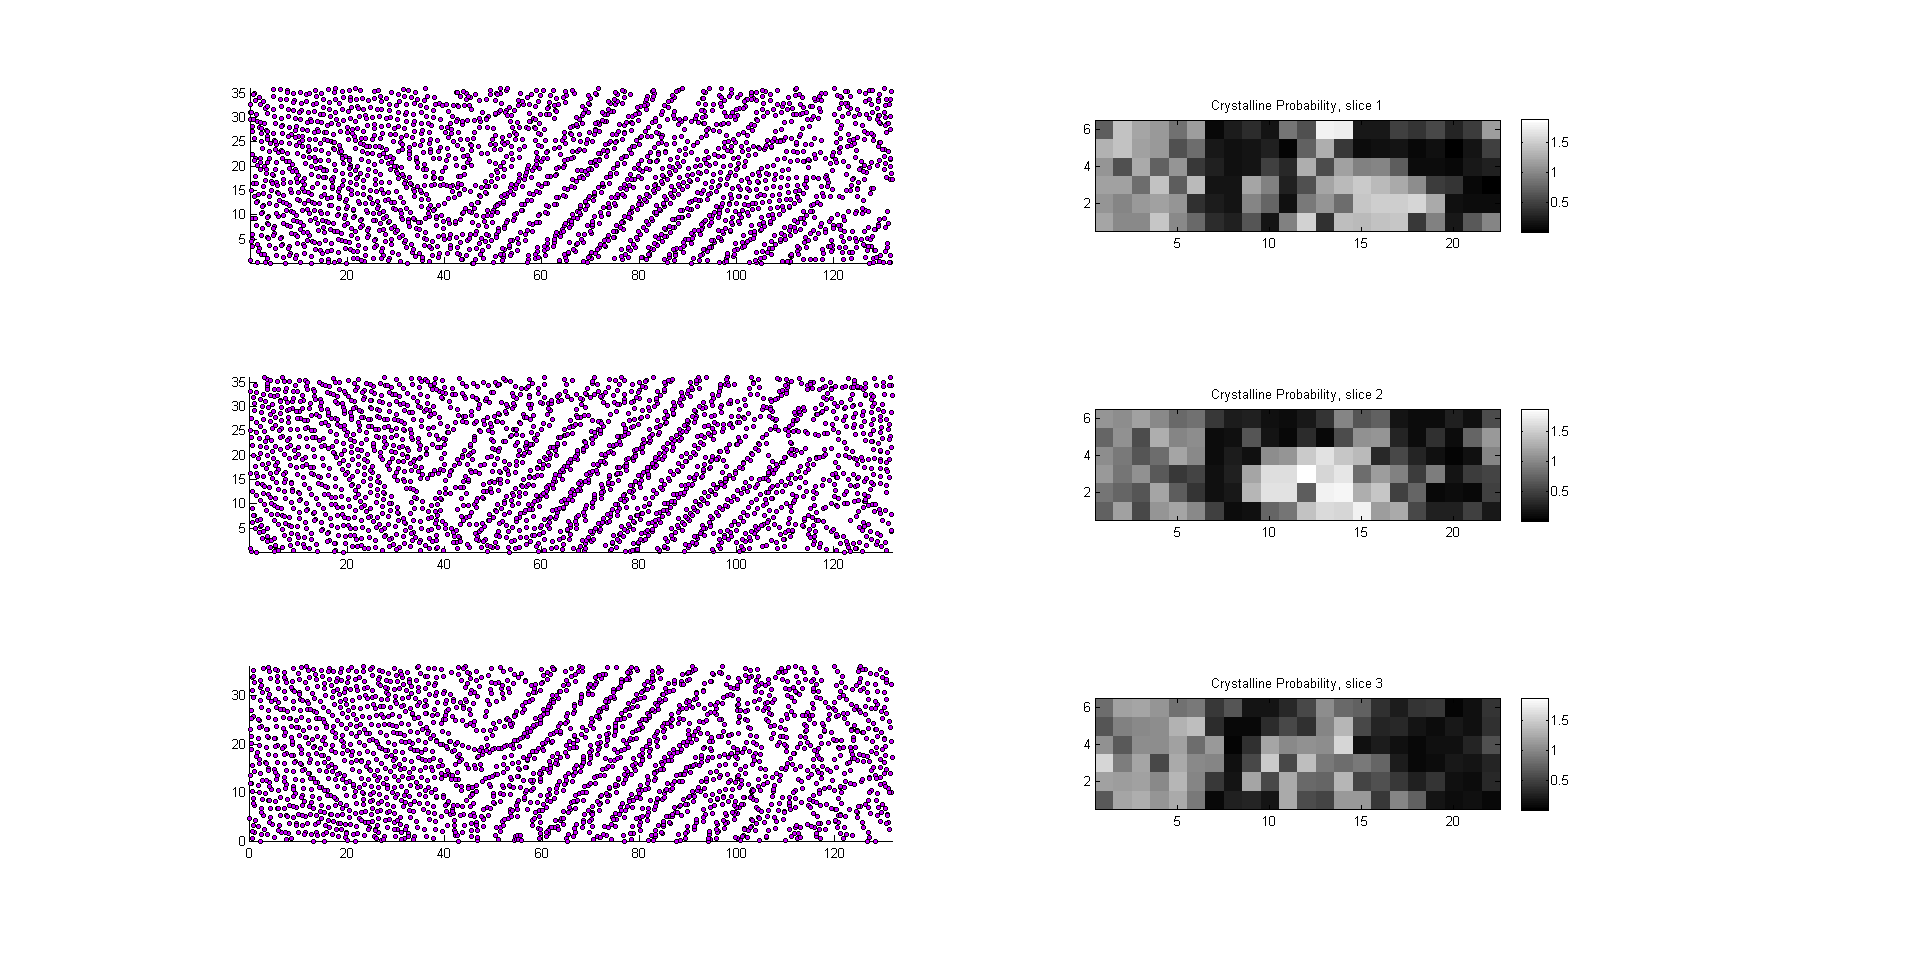
this image shows the crystalline autocorrelation probability measure in each voxel
in this image a voxel was considered ‘crystalline’ if the crystalline autocorrelation probability measure exceed a value of 0.4

References
- Dong, X. et. al. Dependence of mechanical properties on crystal orientation of semi-crystalline polyethylene structures. Polymer 55 (2014) 4248-4257.
- Dong, X. et. al. Effect of network structure from different processing conditions on the mechanical property of semi-crystalline polymers. MRS Symposium, 1619, 2014.
- Ko, M. J., Waheed, N., Lavine, M. S., & Rutledge, G. C. (2004). Characterization of polyethylene crystallization from an oriented melt by molecular dynamics simulation. The Journal of Chemical Physics, 121(6), 2823–32.
- Hossain, D., Tschopp, M. a., Ward, D. K., Bouvard, J. L., Wang, P., & Horstemeyer, M. F. (2010). Molecular dynamics simulations of deformation mechanisms of amorphous polyethylene. Polymer, 51(25), 6071–6083.