Preliminary Results of Crystallinity Analyses
Introduction
Current measures of crystallinity in molecular dynamics simulations (MD), for example density and Herman’s Orienation, are based on characteristics related to crystalline order, however they do not take into account the spatial relationships between individual monomers. We propose a measure which takes advantage of the spatial correlations of monomers in united atom polyethylene MD simulations in the determiniation of crystallinity.
Problem statement: develop a new local measure of crystallinity for polyethylene (PE) molecular dynamics (MD) simulations.
Background
Q: Why do we want to characterize crystallinity at a local level in MD simulations? A: The degree of crystallinity on the microscale governs properties at larger lengthscales.
Q: What are the current measures of crystallinity used in literature A: The most popular are Herman’s Orienation and Density
The mass density of polyethelene calculated based on the number density of monomers in a region of interest. Specifically the following equation was utilized:
Herman’s orientation is a measure of the misorientation between a reference axis and the axis of interest. Herman’s Orientation was calculated by modifying the calculation of Dong, et. al, 2014 and Ko, et. al., 2004 where a vector was calculated between every other monomer. The angle between that vector and vectors found for each chain within a voxel was then used in the below equation to obtain Herman’s orientation measures. This process was repeated for all vectors in a voxel and then the average Herman’s orientation was taken for the voxel. Herman’s orientation ranges from a value of 1 for a perfectly crystalline region to less than 0 for amorphous regions. In literature a value of 0.6 for the Herman’s Orientation is chosen as a threshold to indicate crystallinity.
Q: What are some example of when density or Herman’s Orientation fail in characterizing crystallinity?
In this post the autocorrelations on the thresholds of three measures of crystallinity (density, Herman’s orientation and crystalline degree) are compared. In addition, a plot is presented which compares the the three crystallinity measures for individual voxels of a variety of microstructures.
Review of the crystalline degree measure
First the microstructure function is generated for the voxel of interest and the 2-pt autocorrelation on the polyethylene monomer is performed. These are slices from the autocorrelation of a semicrystalline voxel of the tilt6l simulation at 0.1 strain.
Q: If the monomers are represented as spheres in the microstructure function, what should thier radius be? A: Currently this radius is taken as 0.77 Angstroms, half the bond length. Should this number instead be related to the Lennard-Jones united atom monomer size? What should this relation be?
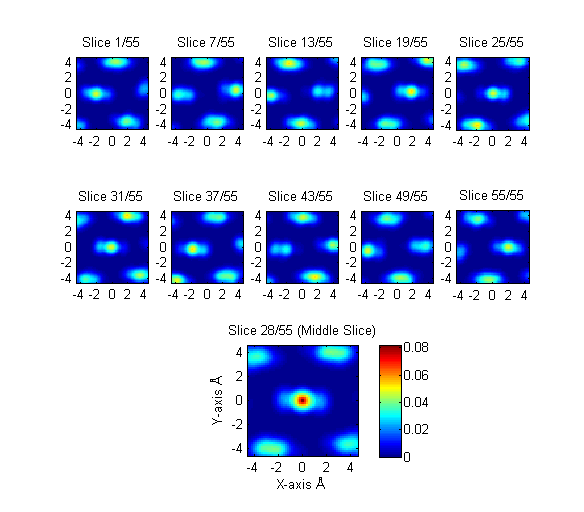
Next, a threshold is applied to the autocorrelation so that only 5.0% of the vectors are above the threshold.
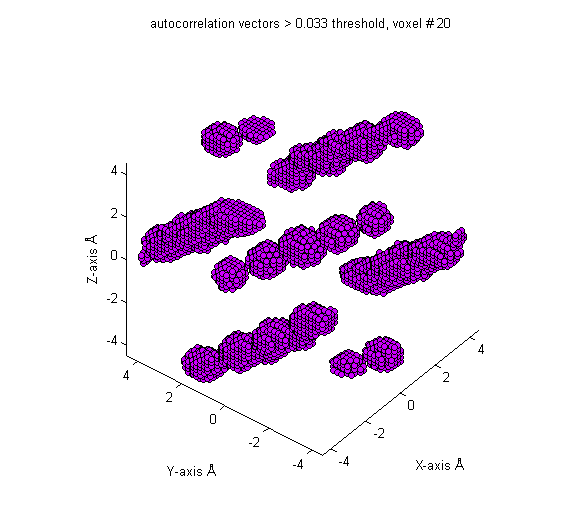
Finally, the crystalline degree measure is taken as the mean probability of those vectors which exceed the threshold.
Results
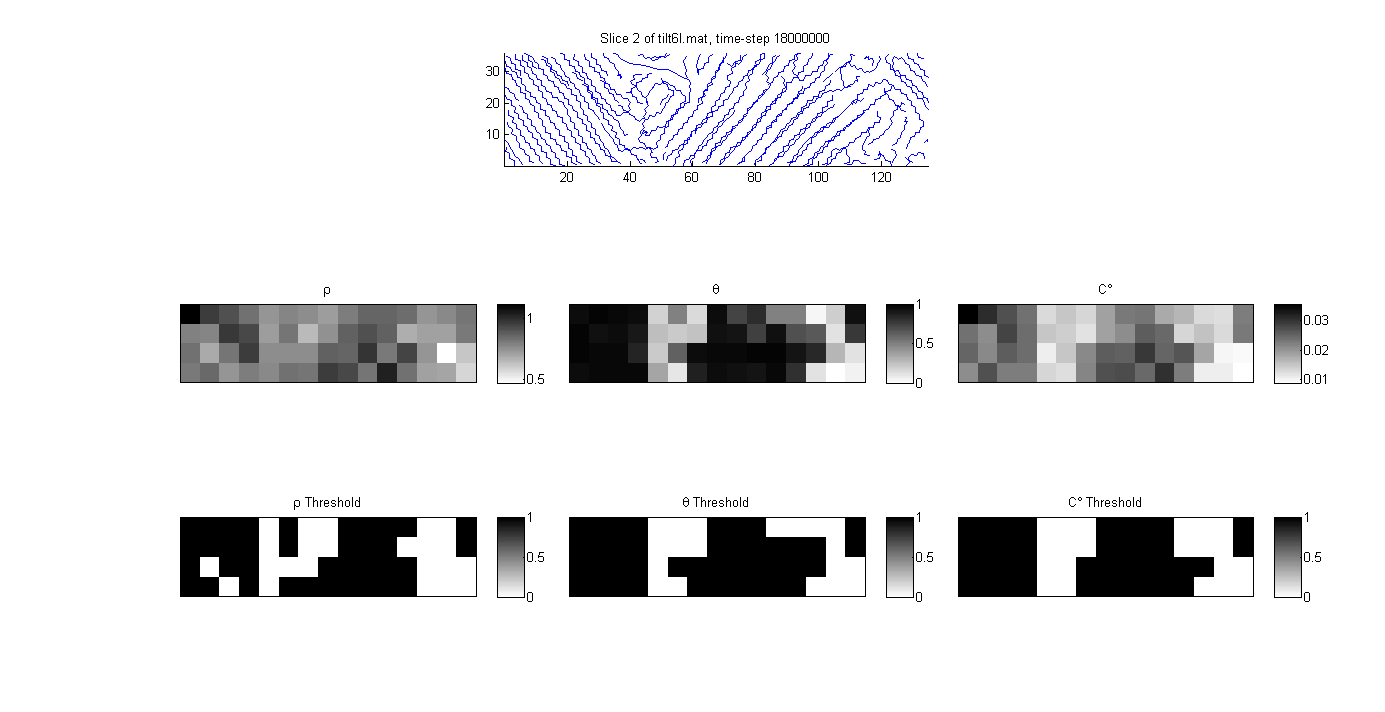
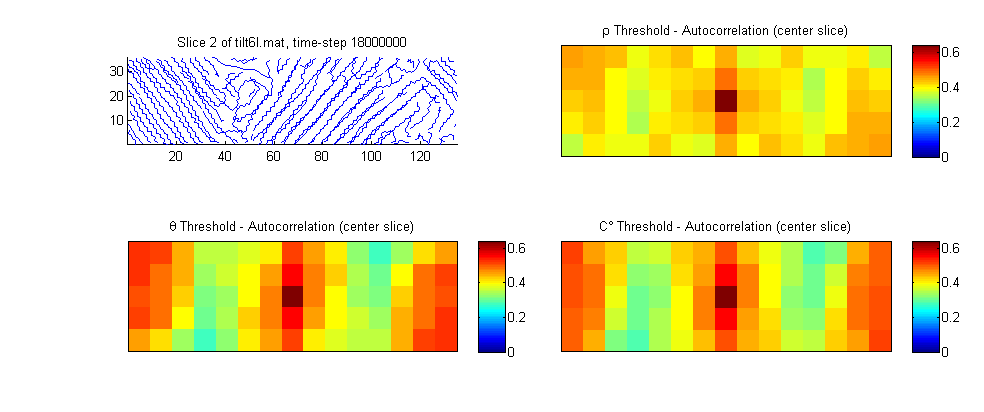
First we examine the values of the crystallinity measures, their thresholds and the associated autocorrelations are shown for a slice of the tilt6l simulation at 0.1 strain. The threshold level is chosen so that the crystalline volume fraction for both density and crystalline degree match that of Herman’s orienatation with a 0.6 threshold (cells with a Herman’s orientation exceeding 0.6 are considered crystalline). The crystalline volume fraction for this microstructure instantiation is 0.64. (voxel density, Herman’s orientation and crystalline degree are shown as $\rho$, $\theta$ and $C^{\circ}$ respectively)
Q: How does the size of the voxel impact the various measures of crystallinity? A: Herman’s Orienatation is less dependent on voxel size. Both density and crystalline degree will increase in accuracy for larger voxel sizes. As the size of the voxel decreases, there are a smaller number of monomers in the voxel, and this increases the scatter in the measure of density. The same is true for the crystalline degree measure, the fewer the number of monomers in the voxel, the weaker are the spatial correlations.
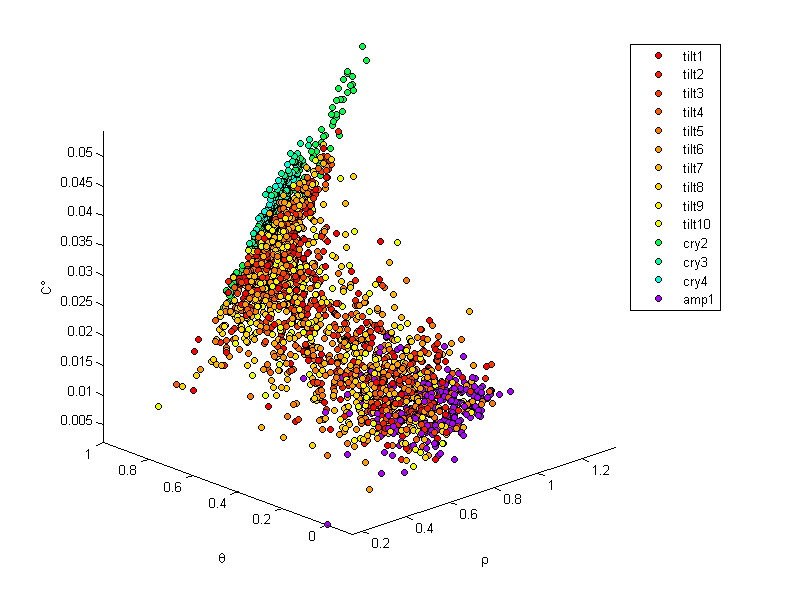
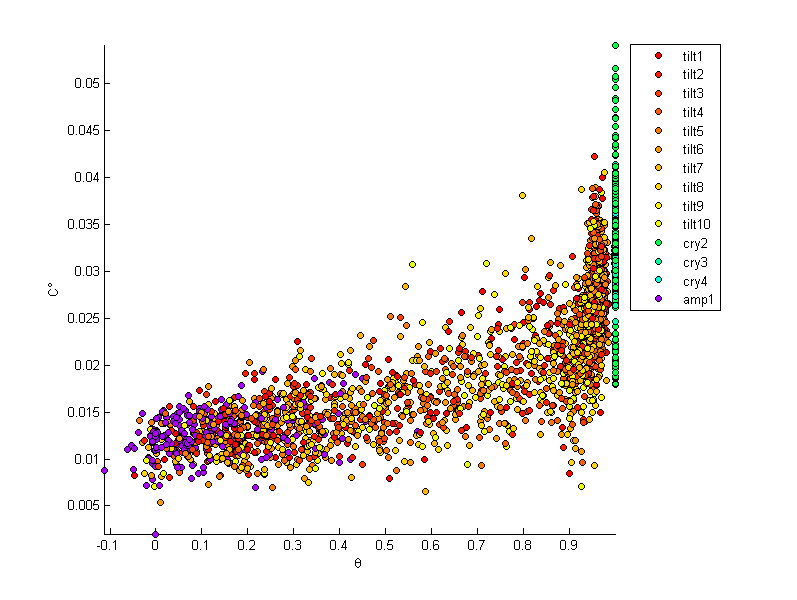
In the following images each point is associated with the values of the three crystallinity measures at each voxel of the microstructures studied. The purpose of this exercise is to explore the relationships between these measures for as wide a range as possible of polyethylene structures.
In the following images tilt1 - tilt10 are strain levels 0.1 to 1.0 for the tilt6l simulation, cry2 through cry4 are perfect crystals and amp1 is an equilibriated amorphous microstructure.
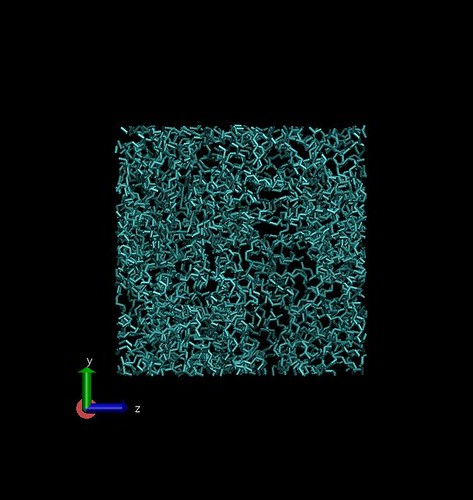
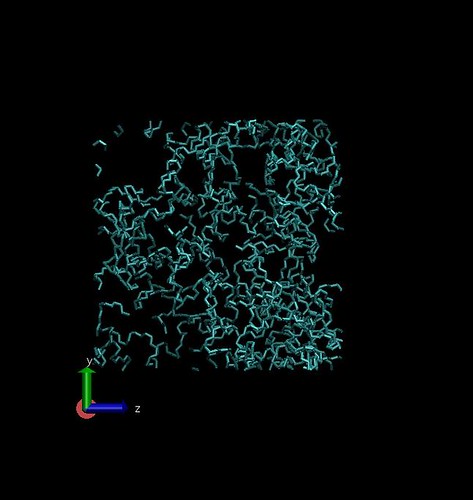
Theoretical amorphous structures are being generated using the Polymer Modeler tool on Nanohub.org. This tool allows creation of amorphous polymer structures of user defined density, conformation probabilities, and processing conditions.
Screenshot of the Polymer Modeler tool

0.86 $g/cm^3$ density in 50 $Angstrom^3$ box
0.31 $g/cm^3$ density in 50 $Angstrom^3$ box
Crystalline regions were developed in Matlab with varying sizes. Using PACKMOL, amorphous and crystalline chains/regions were packed into a box of our simulation size with varying density. In this way we can verify our measures by knowing the exact location and volume fraction of crystalline regions we should receive. The next step is to perform energy minimzation in LAMMPS to get an equilibrated structure and then generate realistic structures through simulation.
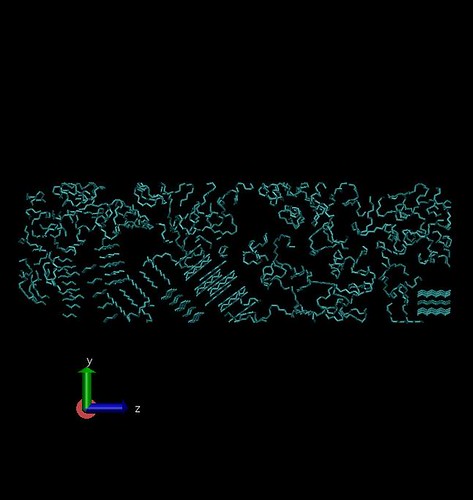
Theoretical semi-crystalline structure
Conclusions
- Density appears to have a weak relationship with both Herman’s orientation and crystalline degree
- Herman’s orientation and crystalline degree are more correlated.
- A clear division can be drawn between amorphous and purely crystalline regions for both the Herman’s orientation and crystalline degree measures.
- For perfect crystals, Herman’s orientation in a voxel is always 1.00 while density and crystalline degree may widely vary
- The 1.00 Herman’s orientation is expected as chains are completely aligned in a perfect crystal
- The density would be expected to converge as the voxel size is increased, though this would also reduce the resolution of the measures
References
- Dong, X. et. al. Dependence of mechanical properties on crystal orientation of semi-crystalline polyethylene structures. Polymer 55 (2014) 4248-4257.
- Dong, X. et. al. Effect of network structure from different processing conditions on the mechanical property of semi-crystalline polymers. MRS Symposium, 1619, 2014.
- Ko, M. J., Waheed, N., Lavine, M. S., & Rutledge, G. C. (2004). Characterization of polyethylene crystallization from an oriented melt by molecular dynamics simulation. The Journal of Chemical Physics, 121(6), 2823–32.
- Hossain, D., Tschopp, M. a., Ward, D. K., Bouvard, J. L., Wang, P., & Horstemeyer, M. F. (2010). Molecular dynamics simulations of deformation mechanisms of amorphous polyethylene. Polymer, 51(25), 6071–6083.
- Benjamin P Haley; Nate Wilson; Chunyu Li; Andrea Arguelles; Eugenio Jaramillo; Alejandro Strachan (2014), “Polymer Modeler,” https://nanohub.org/resources/polymod. (DOI: 10.4231/D3FX73Z1D).
- L. Martínez, R. Andrade, E. G. Birgin, J. M. Martínez. Packmol: A package for building initial configurations for molecular dynamics simulations. Journal of Computational Chemistry, 30(13):2157-2164, 2009.