Choosing between Structure Representations
Introduction
The crystallization behavior of polymers (PE) from the melt is affected by various processing conditions. Through the selection of processing paths and procedures, (e.g. blow molding) the evolution of crystallinity and crystalline orientation in polymeric materials can be controlled. These changes in structure directly affect mechanical properties of interest, therefore it is advantageous to understand how processing leads to structure in this materials system.
We want to characterize the linkage between processing (including material starting condition and the evolution of temperature and the stress/strain state) and structure (including the evolution of crystallinity and crystalline orientation) in semi-crystalline polyethylene.
The preceding text was taken from this original post
VMD Visualization of Constant Volume Uniaxial Tension Experiment
2-point Statistics on Voxelized Simulation Volume
One option is to discretize the simulation volume into smaller spatial bins (voxels). Each of these bins can be further discretized into sub-voxels, so that the location of every monomer is represented by a 1, while all other locations are assigned zero. Then, an auto-correlation can be performed in each larger bin for the monomers. It is hoped that the 2-point statistics for crystalline regions will match the 2-point statistics of an idealized polyethylene crystal to some degree. Using this methodology it is hoped that the degree of crystallinity and orientation of spatial regions can be characterized.
the following image shows the 8 voxels at the corners of the simulation volume

in the following image the location of each monomer (the blue circles) can be binned into sub-voxels (shown as cubes)

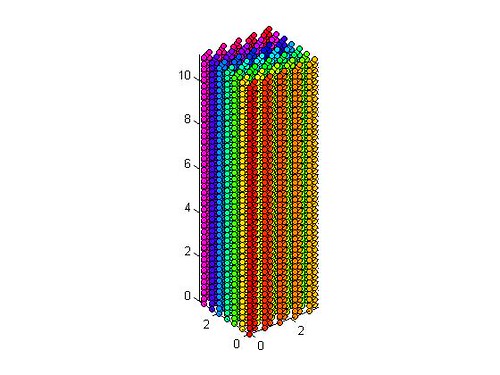
the following two images show the structure of an idealized polyethylene crystal


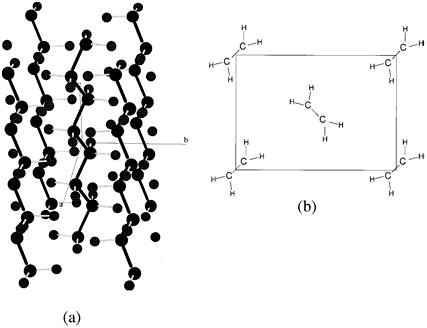
Below is unit cell for PE, orthorhombic. The perfect crystal image above is based on this.

The following image shows the 2-point statistics for a spatial bin. Each point plotted is a location in the 2-point statistics with a probability greater than a specified threshold

2-point Statistics for Entire Simulation Volume
Another option for structural characterization is to bin every monomer, irrespective of the chain it is associated with, into a spatial bin. Bins with a value of 1 contain a monomer, while bins with a value of 0 do not. Then an auto-correlation can be performed for all elements (spatial bins) with a value of 1.
The entire simulation volume

The non-periodic, three-dimensional 2-point statistics (using SpatialStatisticsFFT) were calculated for the entire simulation volume for the first time-step. These statistics show a pattern particular to the structure of crystalline Polyethylene. The below image is a two dimensional representation of these statistics from the z = 0 slice.
slice of 2-pt statistics in the simulation volume

The following image is a representation of the three-dimensional 2-point statistics. Essentially, each point plotted is a location in the 2-point statistics with a probability greater than the specified threshold.
2-point statistics in the simulation volume with a limited vector length

Herman’s Orientation Calculation on Voxelized Simulation Volume
-
Herman’s Orientation describes the orientation of a polymer chain with respect to a reference axis, the angle between the chain and reference axis is .
-
As an update: we will likely abandon the idea of finding the best fit line through each chain within a voxel. Instead we will find the vector for every other atom (avoid counting bond angle in directionality).
- Those vectors will be averaged for an average direction within the voxel (our reference axis). The Herman’s Orientation will be measured for each “every other atom” vector, then averaged.
- If chains are oriented (crystalline) Herman’s will be close to 1. For completely amorphous we can expect something more around 1/3.
- Herman’s orientation is a way for us to get crystal orientation within a voxel.
- We can obtain a measure of degree of crystallinity for each voxel by calculating density within voxel.
where .
Current Research Questions
-
Which of our measures of crystallinity is most effective
-
How finely can we discretize our data without sacrificing accuracy in the determination of crystallinity?
vs.
- How finely must we discretize our data to achieve useful spatial statistics?
References
- Peacock, AJ. Handbook of Polyethylene: structure, properties, and applications. New York, Marcel Dekker, 2000.
- Reiter G, Stobl GR. Progress in Understanding of Polymer Crystallization. New York, Springer, 2007.
- Dong, X. et. al. Dependence of mechanical properties on crystal orientation of semi-crystalline polyethylene structures. Polymer 55 (2014) 4248-4257.
- Dong, X. et. al. Effect of network structure from different processing conditions on the mechanical property of semi-crystalline polymers. MRS Symposium, 1619, 2014.
- Fullwood, D.T. et. al. Microstructure reconstructions from 2-point statistics using phase-recovery algorithms. Acta Materialia 56 (2008) 942-948