Pair Correlations and Orientation Measurements
Introduction
The crystallization behavior of polymers (PE) from the melt is affected by various processing conditions. Through the selection of processing paths and procedures, (e.g. blow molding) the evolution of crystallinity and crystalline orientation in polymeric materials can be controlled. These changes in structure directly affect mechanical properties of interest, therefore it is advantageous to understand how processing leads to structure in this materials system.
We want to characterize the linkage between processing (including material starting condition and the evolution of temperature and the stress/strain state) and structure (including the evolution of crystallinity and crystalline orientation) in semi-crystalline polyethylene.
The preceding text was taken from this original post
Simulation Summary
- 8000 monomer, 20 polymer chain MD simulations
- At initial time-step there are crystalline and amorphous regions
- Uniaxial loading over millions of femtoseconds
Examination of Crystalline and Amorphous Regions
All images below produced using VMD
Animation of Complete Simulation
aniso14 tot v2 from Noah Paulson on Vimeo.
Aniso 15 - Timestep: 11790000

Pair Correlations
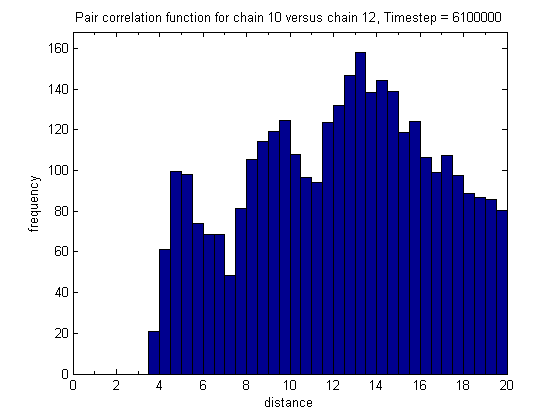
The pair correlation relates the position of objects in space by the distance between them. The distance between every particle and every other particle is binned into a histogram by radius. In our case we relate the position of each monomer in a chain with the monomers from another chain. Each histogram frequency bin is normalized by the volume of the shell which is bounded by the radii bounding the bin. As our simulation volume is periodic, the second chain is tiled in all directions so that the pair correlation reflects the physical scenario.
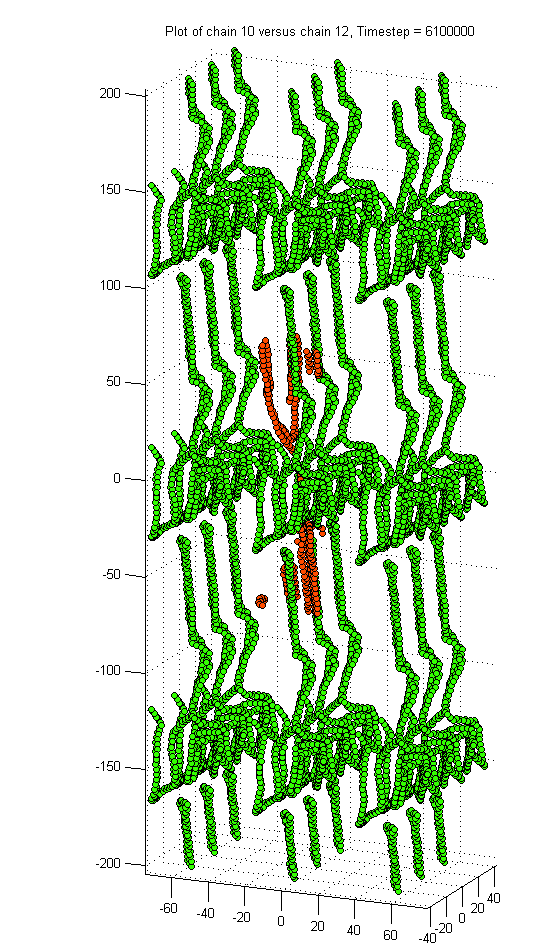
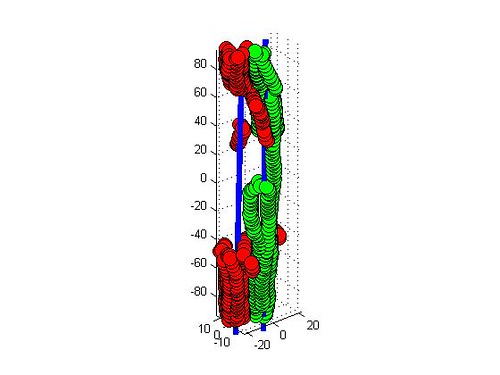
Images of both “crystalline” chains and their associated pair correlation are included below


The preceding images and text were taken from this original post
Orientation Calculations

Theta is the angle between the polymer chain and the reference axis.
Herman’s Orientation is simply a way to describe the orientation of a polymer chain with respect to a reference axis. For our case, we will be locally finding the average Herman’s Orientation within each voxel by comparing the local chain vector with all other local chain vectors in that voxel. If chains are oriented (crystalline) Herman’s will be close to 1. For completely amorphous we can expect something less than 0.5. Calculating Herman’s Orientation is a stepping stone to us eventually describing the 3D orientation of a chain using Euler angles.

The above image is just for 2 chains and over the entire simulation volume. The Hermans orientation is 0.997. Example working code can be found here
Current Research Questions
-
How can we leverage the pair correlation of two chains to better understand the crystallinity in our data?
-
How finely can we discretize our data without sacrificing accuracy in the determination of crystallinity?
vs.
- How finely must we discretize our data to achieve useful spatial statistics?
References
- Dong, X. et. al. Dependence of mechanical properties on crystal orientation of semi-crystalline polyethylene structures. Polymer 55 (2014) 4248-4257.
- Dong, X. et. al. Effect of network structure from different processing conditions on the mechanical property of semi-crystalline polymers. MRS Symposium, 1619, 2014.
- Fullwood, D.T. et. al. Microstructure reconstructions from 2-point statistics using phase-recovery algorithms. Acta Materialia 56 (2008) 942-948